
The first step in processing a sociometric survey is usually the most obvious one: count how many times each participant was chosen and rank the group by that number. The resulting list is informative in its own way. At the top are the people others turn to most often, at the bottom those who are barely noticed. Yet the bottom of the list can bring together people whose position in the group has entirely different causes.
Consider a hypothetical team of seven. Two people close the list: nobody chose Grace, one colleague chose Dan, and by total choices they are practically indistinguishable. The difference emerges when the team is asked a second question, about whom they find hardest to work with. Grace is not named there either; her colleagues have most likely not yet had the chance to get to know her. Dan is named by three people, and all three belong to one close-knit subgroup whose members choose mainly one another.
To keep such differences from dissolving into a single total, the answers are entered into a sociomatrix, a table that records not only how many choices a person received but also who made them. What sociometry is and how to phrase its questions is covered in our article on workplace sociometry. This piece deals with the next stage: the survey has closed, and the answers now need to be processed.
How a sociomatrix is built
A sociomatrix is a square table with as many rows and columns as there are participants in the group. Rows belong to the people who choose, columns to the people who are chosen; each intersection records a choice and, where the order matters, its rank. The diagonal stays empty, since nobody chooses themselves. If the survey included a negative question, rejections are customarily entered in the same table in a different color.[1] Each question requires its own matrix. The advice network and the trust network of the same team rarely coincide, and merging them into one table can easily produce a picture that exists in neither.
Before any calculation, it is worth recalling how the procedure itself was organized. When the number of choices is limited, for example to three, the procedure is called parametric. When participants may name any number of colleagues, the matrix becomes denser and yields an additional measure: how many choices each participant made.[1] Every subsequent calculation depends on this decision, so it should be reported alongside the results.
The hypothetical team in our example answered one question: "Which colleagues would you turn to for advice when facing a difficult task?" Each person named three colleagues in order of preference. The names and answers are fictional.
| Who chooses ↓ / whom → | Alice | Ben | Clara | Dan | Emma | Frank | Grace |
|---|---|---|---|---|---|---|---|
| Alice | × | 1 | 2 | 3 | |||
| Ben | 3 | × | 1 | 2 | |||
| Clara | 1 | 2 | × | 3 | |||
| Dan | 1 | 3 | × | 2 | |||
| Emma | 2 | 3 | 1 | × | |||
| Frank | 3 | 1 | 2 | × | |||
| Grace | 1 | 2 | 3 | × | |||
| Choices received | 4 | 6 | 4 | 1 | 3 | 3 | 0 |
The matrix reads in two directions. A row shows whom the participant relies on: Dan, for instance, turns to Ben, Frank and Clara for advice. A column shows the reverse, who relies on that participant, and the bottom row gives the number of choices received. The matrix holds 21 entries in all, three from each of the seven participants.
For a group of seven, filling in such a table takes about fifteen minutes. In a department of forty, the matrix already runs to 1,560 cells, and a single error in transferring the answers can quietly distort someone's status. In formeasure, the matrix, the statuses and the sociogram are generated automatically as soon as the survey is complete.
What to calculate: status, mutuality and cohesion
The number of choices received is meaningful only within a single group. Across groups of different sizes it misleads. Ben's six choices in a team of seven mean that every member named him, whereas in a class of thirty students the same six choices would amount to roughly one vote in five.
That is why the number of choices received is divided by N − 1, the maximum number of choices a participant could have received. The resulting value, sociometric status, ranges from zero to one and allows comparison between groups. Where the order of choices matters, the first place is given greater weight; Kondratyev gives a version of the formula with the same division by N − 1.[1]
| Participant | Choices received | Status R / (N − 1) | Mutual choices |
|---|---|---|---|
| Ben | 6 | 1.00 | 3 |
| Alice | 4 | 0.67 | 3 |
| Clara | 4 | 0.67 | 3 |
| Emma | 3 | 0.50 | 2 |
| Frank | 3 | 0.50 | 2 |
| Dan | 1 | 0.17 | 1 |
| Grace | 0 | 0.00 | 0 |
The most revealing information in the matrix concerns mutual choices. A choice is mutual when two participants have named each other; our team has seven such pairs: Alice and Ben, Alice and Clara, Alice and Emma, Ben and Clara, Ben and Frank, Clara and Emma, Dan and Frank. Set against the totals, these pairs change the interpretation considerably. Alice, Clara and Emma all chose one another and form the cohesive core of the team, although their totals merely look similar. Dan's single choice turns out to be mutual: his tie to Frank is confirmed by both sides. Grace, by contrast, named Ben, Emma and Frank, yet none of them chose her in return.
The group cohesion index calls for particularly careful reading. It is the only measure that describes the group as a whole, it is convenient to present to management, and for precisely that reason it matters how it was calculated. Dividing the number of mutual pairs by the number of all possible pairs, N × (N − 1) / 2, gives our team 7 out of 21, or 0.33. Calculating instead the share of choices that were reciprocated gives 14 out of 21, or 0.67. The data are identical, yet the values differ by a factor of two.
The first formula also has a natural ceiling. With three choices per participant, seven people cannot form more than ten mutual pairs, so the index in this group will not exceed 0.48 even where relationships are at their closest. Kondratyev, reviewing sociometric indices, observes that merely listing their names would take up too much space.[1] From this follows a modest but dependable rule: a group is properly compared only with itself at a later measurement, using the same formula and the same choice limit.
Stars, isolates and the groups in between
The division of participants into status groups goes back to Jacob Moreno's sociometry. Moreno mapped the choices, attractions and rejections within a group and identified subgroups and isolated members on those maps.[2] In the sociometric tradition, those who receive the most choices are called sociometric stars, those who receive none are called isolates, and those named in response to a negative question are called rejected. Between these poles lie intermediate groups, and here methods diverge: some authors distinguish two such groups, others three, and they use different terms. The classification scheme should therefore be stated explicitly in any report.
Assigning a participant to a group requires numeric thresholds, and the risk of borrowing unsuitable ones is considerable. Russian-language handbooks often cite the thresholds of Ya. L. Kolominsky, although he adapted sociometry for children's groups and derived his cutoffs from school classes:[1]
| Category | Choices received |
|---|---|
| Sociometric stars | 6 or more |
| Accepted, or preferred | 3–5 |
| Not accepted | 1–2 |
| Neglected, or isolated | 0 |
These thresholds were set for classes that, as a rule, have no more than thirty members.[1] In our team they formally apply: Ben falls into the star category, Alice, Clara, Emma and Frank into the accepted, Dan into the not accepted, Grace into the isolated. In a group of seven with three choices each, however, only someone named by every single member can become a star, whereas in a class one vote in five suffices for the same status. For work teams it is more sound to set thresholds relative to the group's own average.
Isolated vs rejected: why a negative question matters
A positive question reveals whom participants are drawn to; a negative question is asked to establish social distance, that is, whom they prefer to avoid.[3] Without it, the position of a participant with no choices remains undetermined. Such a person may simply go unnoticed or, conversely, be deliberately avoided, and a matrix of positive choices cannot tell the two apart.
Research on sociometric status has long distinguished these situations. Coie, Dodge and Coppotelli proposed describing a participant's position along two dimensions: social preference, the difference between positive and negative nominations, and social impact, their sum. Combining the two yields five types: popular, rejected, neglected, controversial and average.[4] A rejected participant is named often, but in response to the negative question; a neglected one is hardly named at all.
The second question in our example was worded as follows: "Who would you find it hardest to work with on a shared task?" Participants could name one colleague or nobody.
| Who chooses | Named |
|---|---|
| Alice | Dan |
| Ben | Emma |
| Clara | Dan |
| Dan | Emma |
| Emma | Dan |
| Frank | Clara |
| Grace | nobody |
The positions of Grace and Dan now differ fundamentally. Grace received neither positive nor negative choices: she is not yet visible in the team, which is often how a person looks before colleagues have had the chance to get to know them. Dan received one mutual positive choice and three negative ones, and all three came from Alice, Clara and Emma, the very subgroup in which choices are mutual. Dan, in turn, named Emma as the hardest person to work with.
To conclude on this basis that Dan is a "problem" employee would be a mistake. The matrix records tension between him and one subgroup of the team. Its causes are better explored together with the manager: a protracted dispute over a project, differing roles in the workflow, or Dan's recent transfer from another department.
Using a negative question in a work team calls for particular tact. Its answers point to specific colleagues and are among the most sensitive data a survey can produce. The survey should offer a "nobody" option, and the matrix of negative choices should neither be shown to the team nor used in performance reviews. Sociometry cannot be anonymous by its very nature, so the circle of people with access to the answers must be agreed before the study begins; our article on anonymous employee surveys discusses this in more detail.
The target sociogram: from matrix to diagram
A matrix is convenient for calculation, but the structure of the group is hard to read in tabular form, and a sociogram is drawn to make it visible. The general principles of drawing one are set out in our article on workplace sociometry. For presenting processed results, the target sociogram is the most convenient: a system of concentric rings with the highest-status participants at the center and those chosen less often toward the periphery.
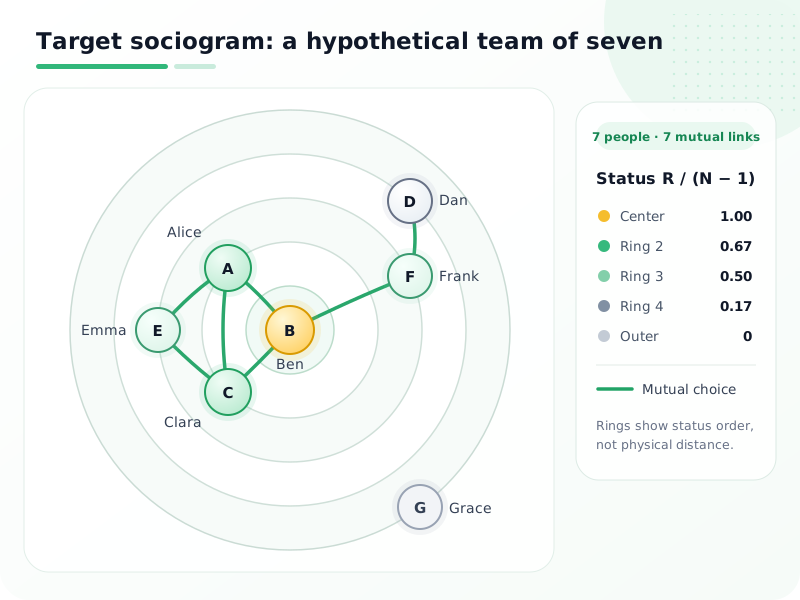
The target takes in at a glance what previously had to be extracted from the tables piece by piece. Ben, at the center, is linked by mutual choices to Alice, Clara and Frank. Alice, Clara and Emma form a closed triangle. Dan, on the fourth ring, is connected to the team by a single mutual choice, with Frank, while Grace on the outer ring has no mutual ties at all.
The distance between the rings, however, is not a measure. The rings reflect the order of statuses, not the size of the differences between them, so Dan's distance from the center cannot be expressed as a number.
Common mistakes in processing sociometry
The first mistake is to read status as an employee ranking. Status answers a narrow question: how often a participant was chosen on one criterion at the time of the survey. Ben is the center of the advice network, but that does not make him the best employee or a ready-made manager. A concentration of choices on one person is, if anything, a risk: in Ben's absence, the team has no one to turn to for advice.
The second mistake concerns borrowed thresholds. Kolominsky's cutoffs for "stars" and "isolates" were calibrated on school classes of about thirty students.[1] They are an adaptation for children's groups, and in a work team of seven the same categories take on a different meaning.
Less conspicuous is the mistake of comparing results over time. If participants were given three choices last year and five this year, the matrices and indices will not be comparable.[1] Any rise in cohesion will then reflect the change in procedure rather than any change within the team.
Finally, a single measurement reflects the state of the group at one moment only. The structure of ties shifts after a reorganization, the arrival of new staff or a change of manager, and data gathered in October may be out of date by spring. A repeat study a few months later will show whether new ties have formed and whether Dan remains on the periphery.
Processing sociometry in formeasure
In formeasure, processing requires no manual calculation. For each question the system builds a sociogram that displays received, sent and mutual choices separately. For each participant it shows the status index, the number of choices received and the list of colleagues who made them. Participants are automatically assigned to status groups (stars, preferred, accepted, isolated and rejected), and a cohesion index with a scale of levels is calculated for the group as a whole.
The approach rests on Moreno's classic sociometry rather than its school adaptations. Because authors name the intermediate groups differently, comparisons with other studies are best based on the status index itself rather than on the name of the group alone.
Frequently asked questions about the sociomatrix
What is a sociomatrix?
A sociomatrix is a square table into which the answers of a sociometric survey are entered. Its rows correspond to the participants who make choices, its columns to those who are chosen. Each question has a matrix of its own, and negative choices are usually marked in a different color.[1]
How is a sociomatrix different from a sociogram?
A sociomatrix serves for calculation, a sociogram for visual presentation. A sociogram shows the same choices as links between participants and is drawn from the completed matrix.[1]
How do you calculate sociometric status?
Divide the number of choices received by N − 1, where N is the number of participants in the group. The result, between zero and one, shows what share of the maximum possible choices the participant received.
How many choices should participants get?
Classic examples limit the number of choices to three. A limit makes participants comparable but also sets an upper bound on cohesion. What matters is that the limit stays the same across repeat measurements.
How do you calculate a group cohesion index?
One common version is the ratio of the number of mutual pairs to N × (N − 1) / 2. Another is the share of choices that were reciprocated. Since the formulas produce different values, a report should state which one was used.
How is an isolated participant different from a rejected one?
An isolated participant is hardly named in either positive or negative questions. A rejected participant is named often, but in response to the negative question. The two can only be distinguished if the survey includes a negative question.[4]
Can sociometry be processed online?
Yes. Dedicated tools build the matrix, calculate statuses and produce the sociogram automatically. In formeasure this happens as soon as the survey is complete.
Can sociometry results be shown to the team?
General conclusions about the structure of the group can be discussed with the team, for example that there are few ties between two parts of a department. Individual statuses, particularly from negative questions, remain with those who conducted the study.
Sources
- Kondratyev M. Yu. — A methodological algorithm for determining the integral intragroup status of a member of a contact community // Social Psychology and Society. 2014. No. 3. P. 125–141 (in Russian). https://psyjournals.ru/journals/sps/archive/2014_n3/sps_2014_n3_70711.pdf
- AANZPA (Australian and Aotearoa New Zealand Psychodrama Association) — Sociometry. https://aanzpa.org/about-psychodrama/sociometry/
- Hysa X. — Sociometric Tests // The SAGE Encyclopedia of Research Design. 2nd ed. SAGE, 2022. https://sk.sagepub.com/ency/edvol/the-sage-encyclopedia-of-research-design-2e/chpt/sociometric-tests
- Coie J. D., Dodge K. A., Coppotelli H. — Dimensions and types of social status: A cross-age perspective // Developmental Psychology. 1982. Vol. 18, No. 4. P. 557–570. https://doi.org/10.1037/0012-1649.18.4.557